Businesses collect large volumes of operational and customer data. To interpret this data and apply it to business decisions, teams rely on two main tools: dashboards and static reports. These tools organize and present information in different formats and serve distinct purposes. Understanding how each format works allows managers to select the right one based on context, audience, and goals.
What Are Dashboards?
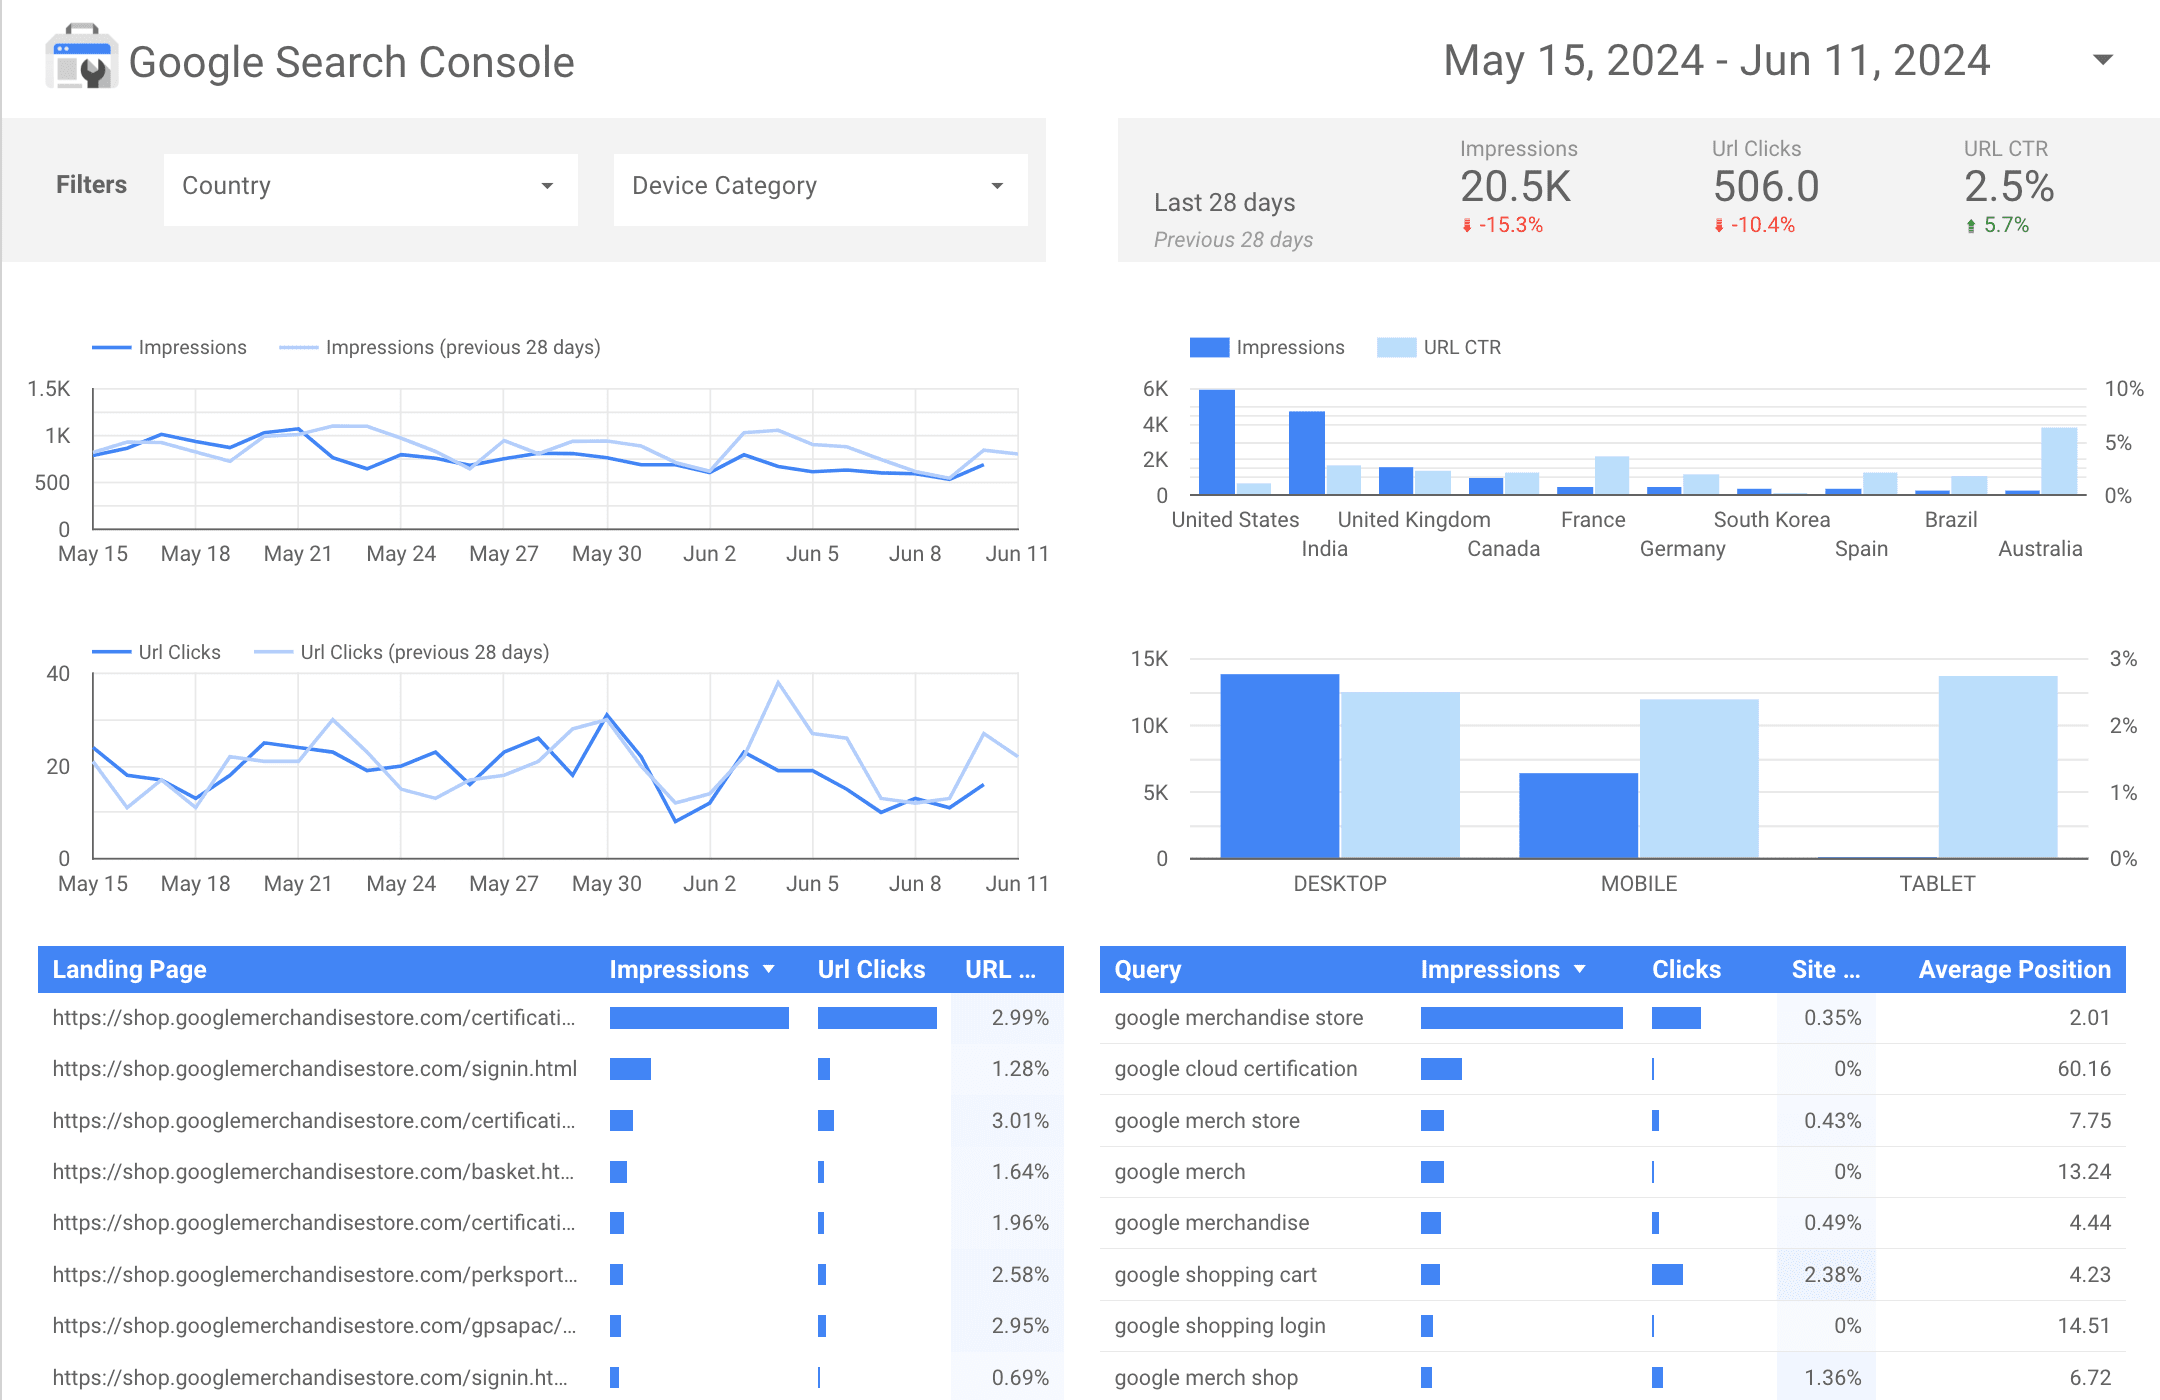
Dashboards consolidate multiple data sources into a unified visual interface. Analysts configure dashboards to display key metrics, trends, and alerts in real time. Managers and executives use dashboards to track performance, detect deviations, and respond to operational changes without delay.
Chiron IT, a Microsoft Certified Partner, provides data visualization services that focus on clarity, speed, and actionable insights. As a data visualization consultant, Chiron IT builds dashboards that allow business users to evaluate live data through intuitive charts, graphs, and filters. Chiron structures each dashboard around specific business objectives, such as monitoring sales pipelines, tracking service requests, or analyzing website behavior.
Chiron also supports decision-making by integrating drill-down features and advanced filtering tools. This enables teams to move from summary views to detailed breakdowns without switching platforms or requesting additional documents.
What Are Static Reports?
Static statements represent data in a fixed format at a specific point in time. Analysts generate reports using defined queries and export them as documents — often in PDF, Excel, or printed formats. Reports typically follow a linear structure, including summaries, tables, explanatory notes, and standardized visualizations.
Business units use static documents to communicate historical performance, document compliance, and prepare materials for formal presentations. Analysts structure these reports for clarity and completeness. Because static reports do not refresh automatically, they capture data as it existed during the reporting period.
Unlike dashboards, static reports do not support interaction. Users cannot explore new variables, apply filters, or drill into underlying data without requesting additional reports.
How Dashboards Differ from Static Reports
- Real-time interfaces connect directly to live data sources, while static documents display figures captured at a specific point in time.
- Interactive tools allow users to apply filters, explore details, and adjust views. Static formats lock content and prevent any user-driven changes.
- Systems refresh visual displays automatically when new data becomes available. Reports require manual generation and do not update after distribution.
- Web-based platforms use charts, graphs, and visual components for faster interpretation. Traditional documents rely on text blocks, tables, and basic diagrams.
- Use dynamic interfaces for ongoing monitoring and operational analysis. Choose formal documents for audits, compliance reviews, or executive briefings.
- Analysts and managers rely on interactive views for daily oversight. Executives and regulatory bodies often request structured summaries.
- Customizable dashboards adapt to specific goals and metrics. Standard reports follow a fixed layout and predefined data scope.
Teams that manage daily operations or track live metrics benefit from dashboards. These tools consolidate real-time data into actionable visuals, allowing immediate adjustments. Dashboards suit environments where conditions change frequently, and users need fast access to up-to-date insights.
Teams that prepare quarterly summaries, financial disclosures, or audit packages rely on static reports. Reports provide clean, well-documented snapshots that meet external and internal compliance standards.